My Role
UX Reaserch
Tool
Usability Test
Research type
Quantitative Research, Unmoderated
Summary
After changes in the app’s homepage (“financial dashboard”), customers frequently called support, which created both user frustration and higher service cost. My goal was to test whether restoring the old version would solve the issue, or if the complaints were misleading. To assess this, a usability test with 422 real customers was conducted. he results showed the new design outperformed the old — saving the team from an unnecessary (and costly) rollback.


The new interface outperformed the old one

The problem
Complaints about a link disappearing
After adding the view of the latest transactions to Cal’s app homepage (UX by me), several customers called the customer service complaining they “can’t reach their transactions view per card” anymore. Each complaint represented wasted support time and growing pressure on the product team to reverse the change. But were complaints representing a real problem or not?
The evolution of the home screen
Circled in black: two ways to reach the transactions screen. We wanted to test whether the complaints are a small group making noise or an actual problem in a large scale that requires a rollback.


Recruitment
422 valid participants
Participants’ recruitment was done via SMS. This yielded 422 valid responses, which were enough to detect differences in performance. They were randomly assigned to 2 groups:
1. Experiment group: interacted with a homepage consisting considered changes
2. Control group: interacted the current homepage, on which customers complained
Upon clicking the link in the text message, participants started the test.
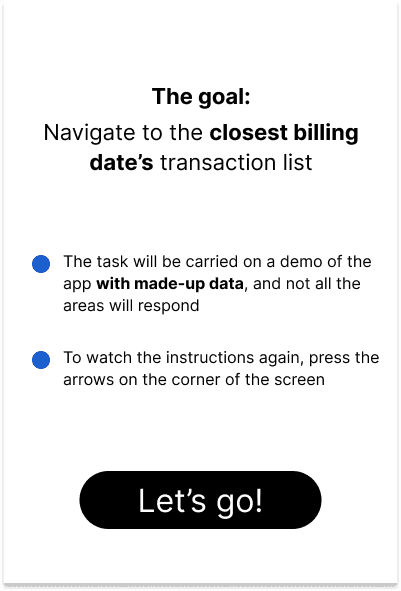
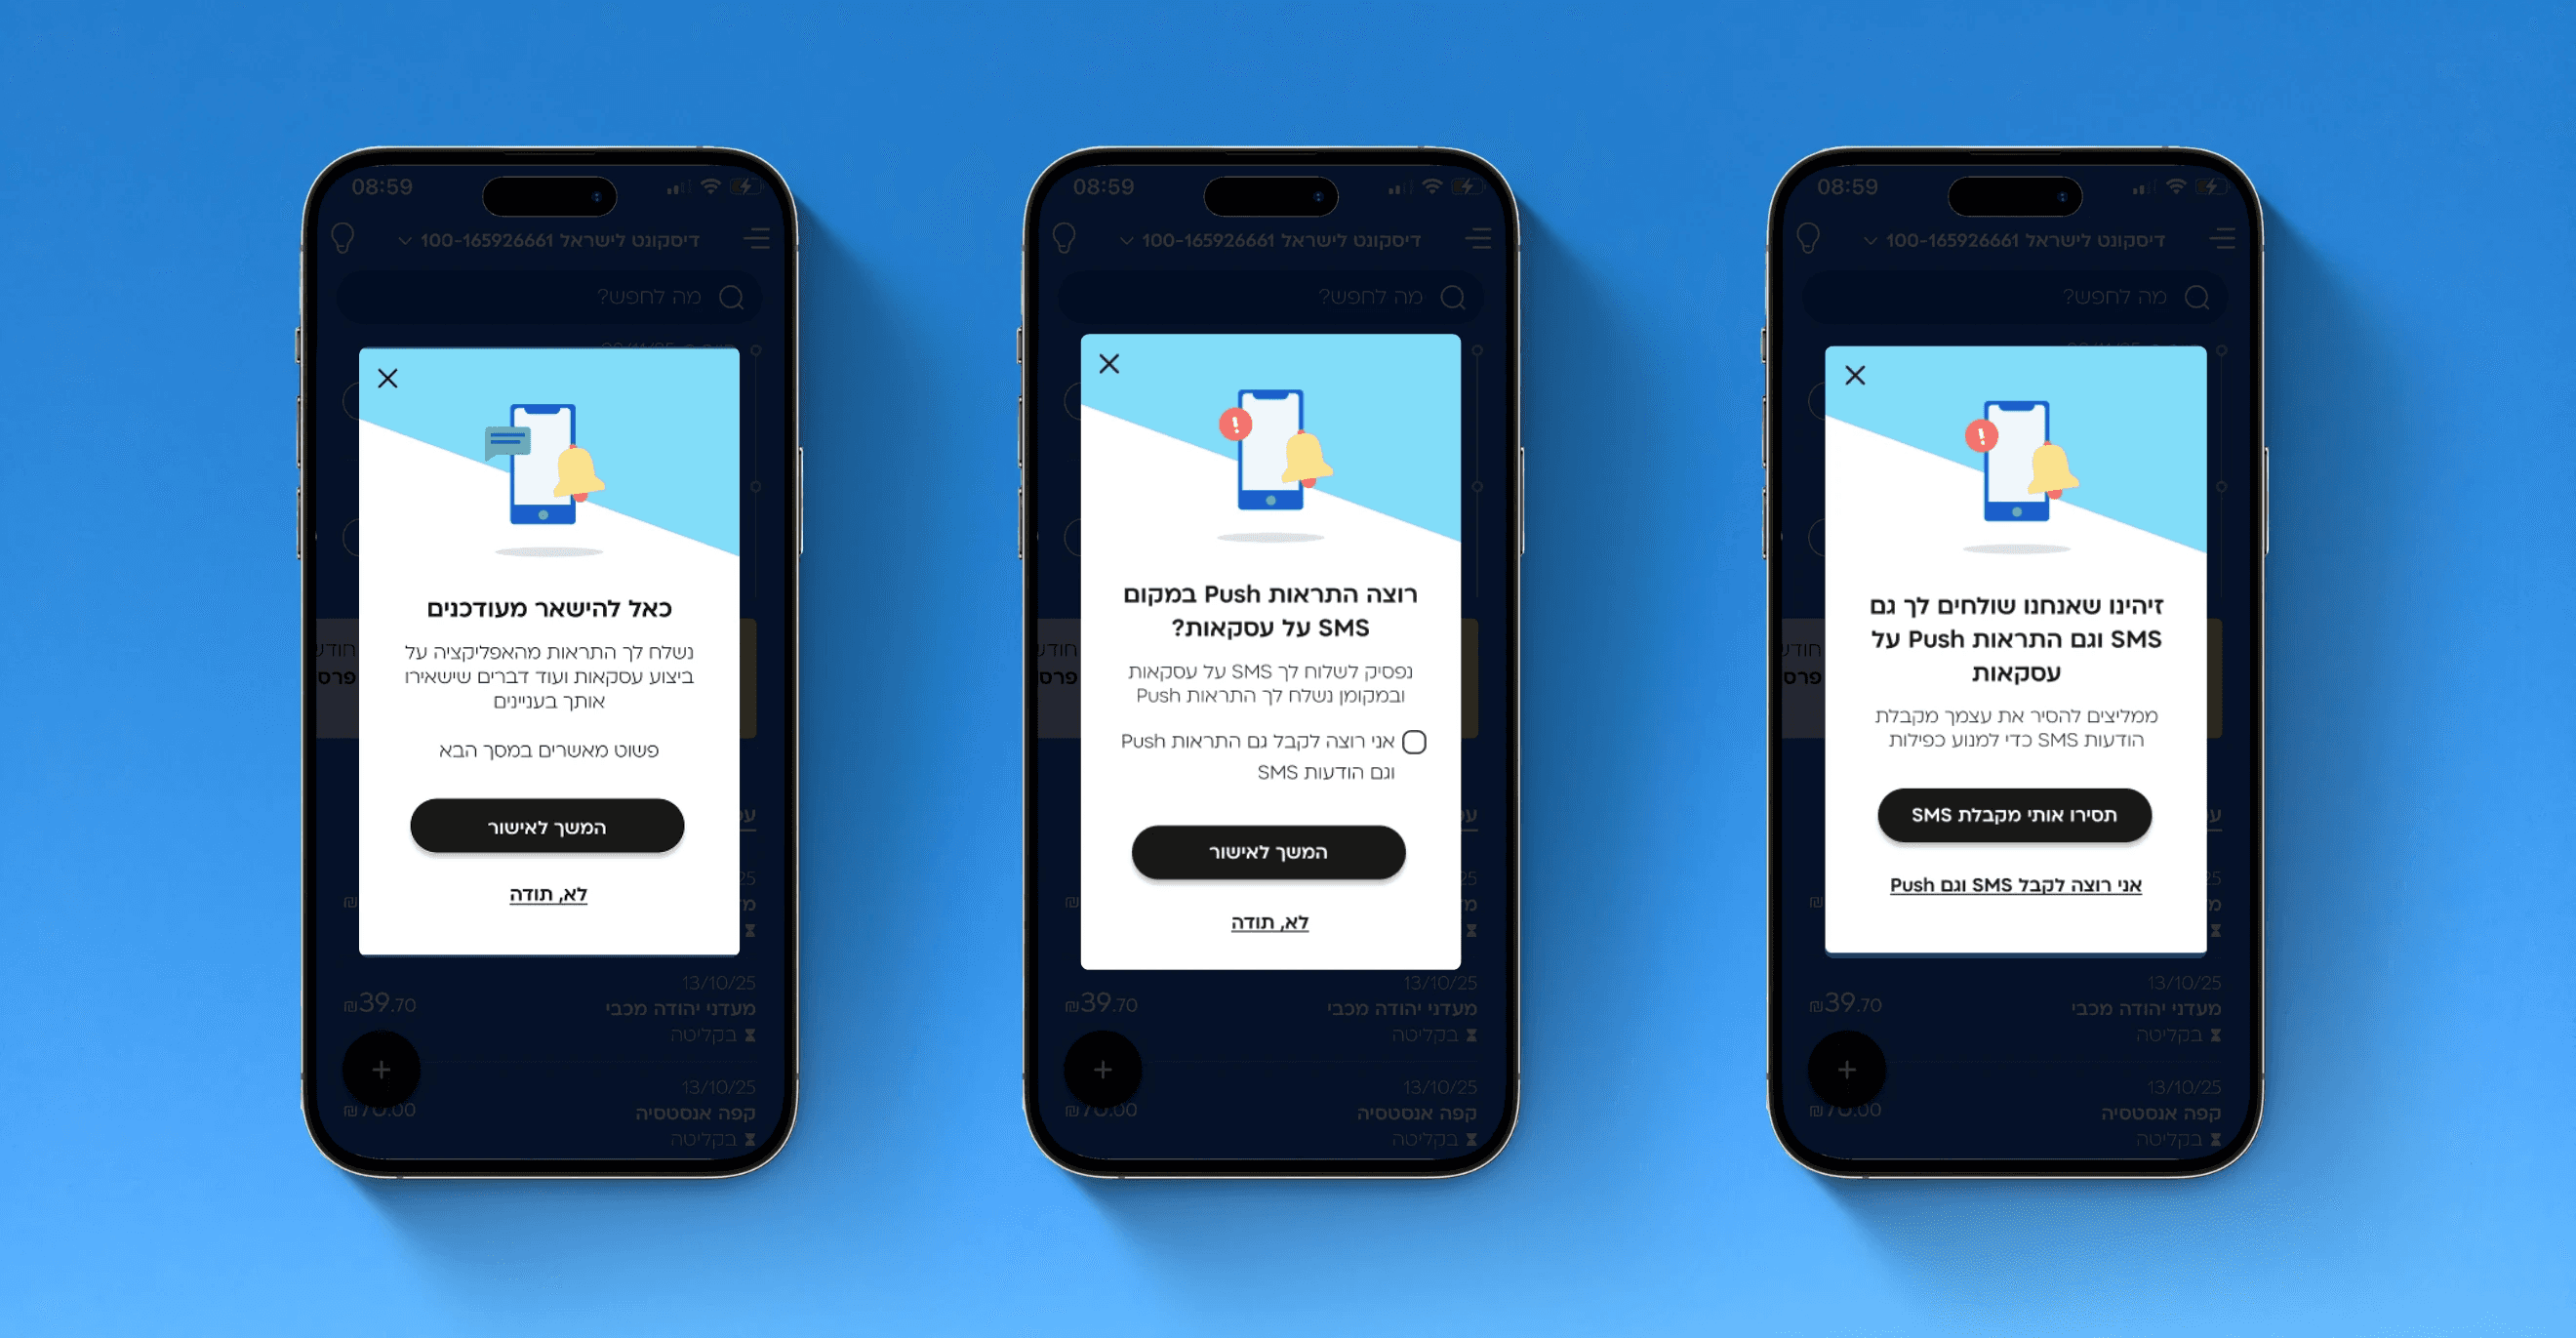
The instructions screen participants were shown prior starting the usability test
Usability test
What if we bring back the link?
I ran a usability test to assess whether it’s necessary to move back the link above the fold. For this, the participants saw the current state, and half the participants saw the considered state


A comparison between the two conditions was made in terms of:
1. Success rate: the rate of reaching the desired screen.
2. Misclicks: the rate of clicking on the “more transactions” link (in red).
3. Leaving rate: the rate which participants left the task.
Findings
The new homepage success rates were
higher than the old one
The results revealed that the control group (current homepage) outperformed the experiment group (old homepage) in all 3 measures: higher success rate, lower misclicks rate and higher rate of task finish.
Test results

Higher success with current design
Conclusion
Rolling back would have been counterproductive
The results revealed that the new homepage outperformed the old one. Results showed that even if some customers called the support - the vast majority handled the change very well. Like one customer’s feedback on the usability test: “It was okay, you just need to remember to scroll down to reach the screen, I got used to it”. This showed me that when implemented carefully, users can get used to changes.
Further investigating
Looking at ages revealed even a better picture
Digging deeper, we found most test participants were older than our real user base. Younger users, who represent the majority of active app users, performed even better on the new design. This strengthened confidence in our decision to keep the redesign The conclusion is clear: the situation among real app uers is even better then the performance in the test.
Age Comparison: Participants vs. App Users
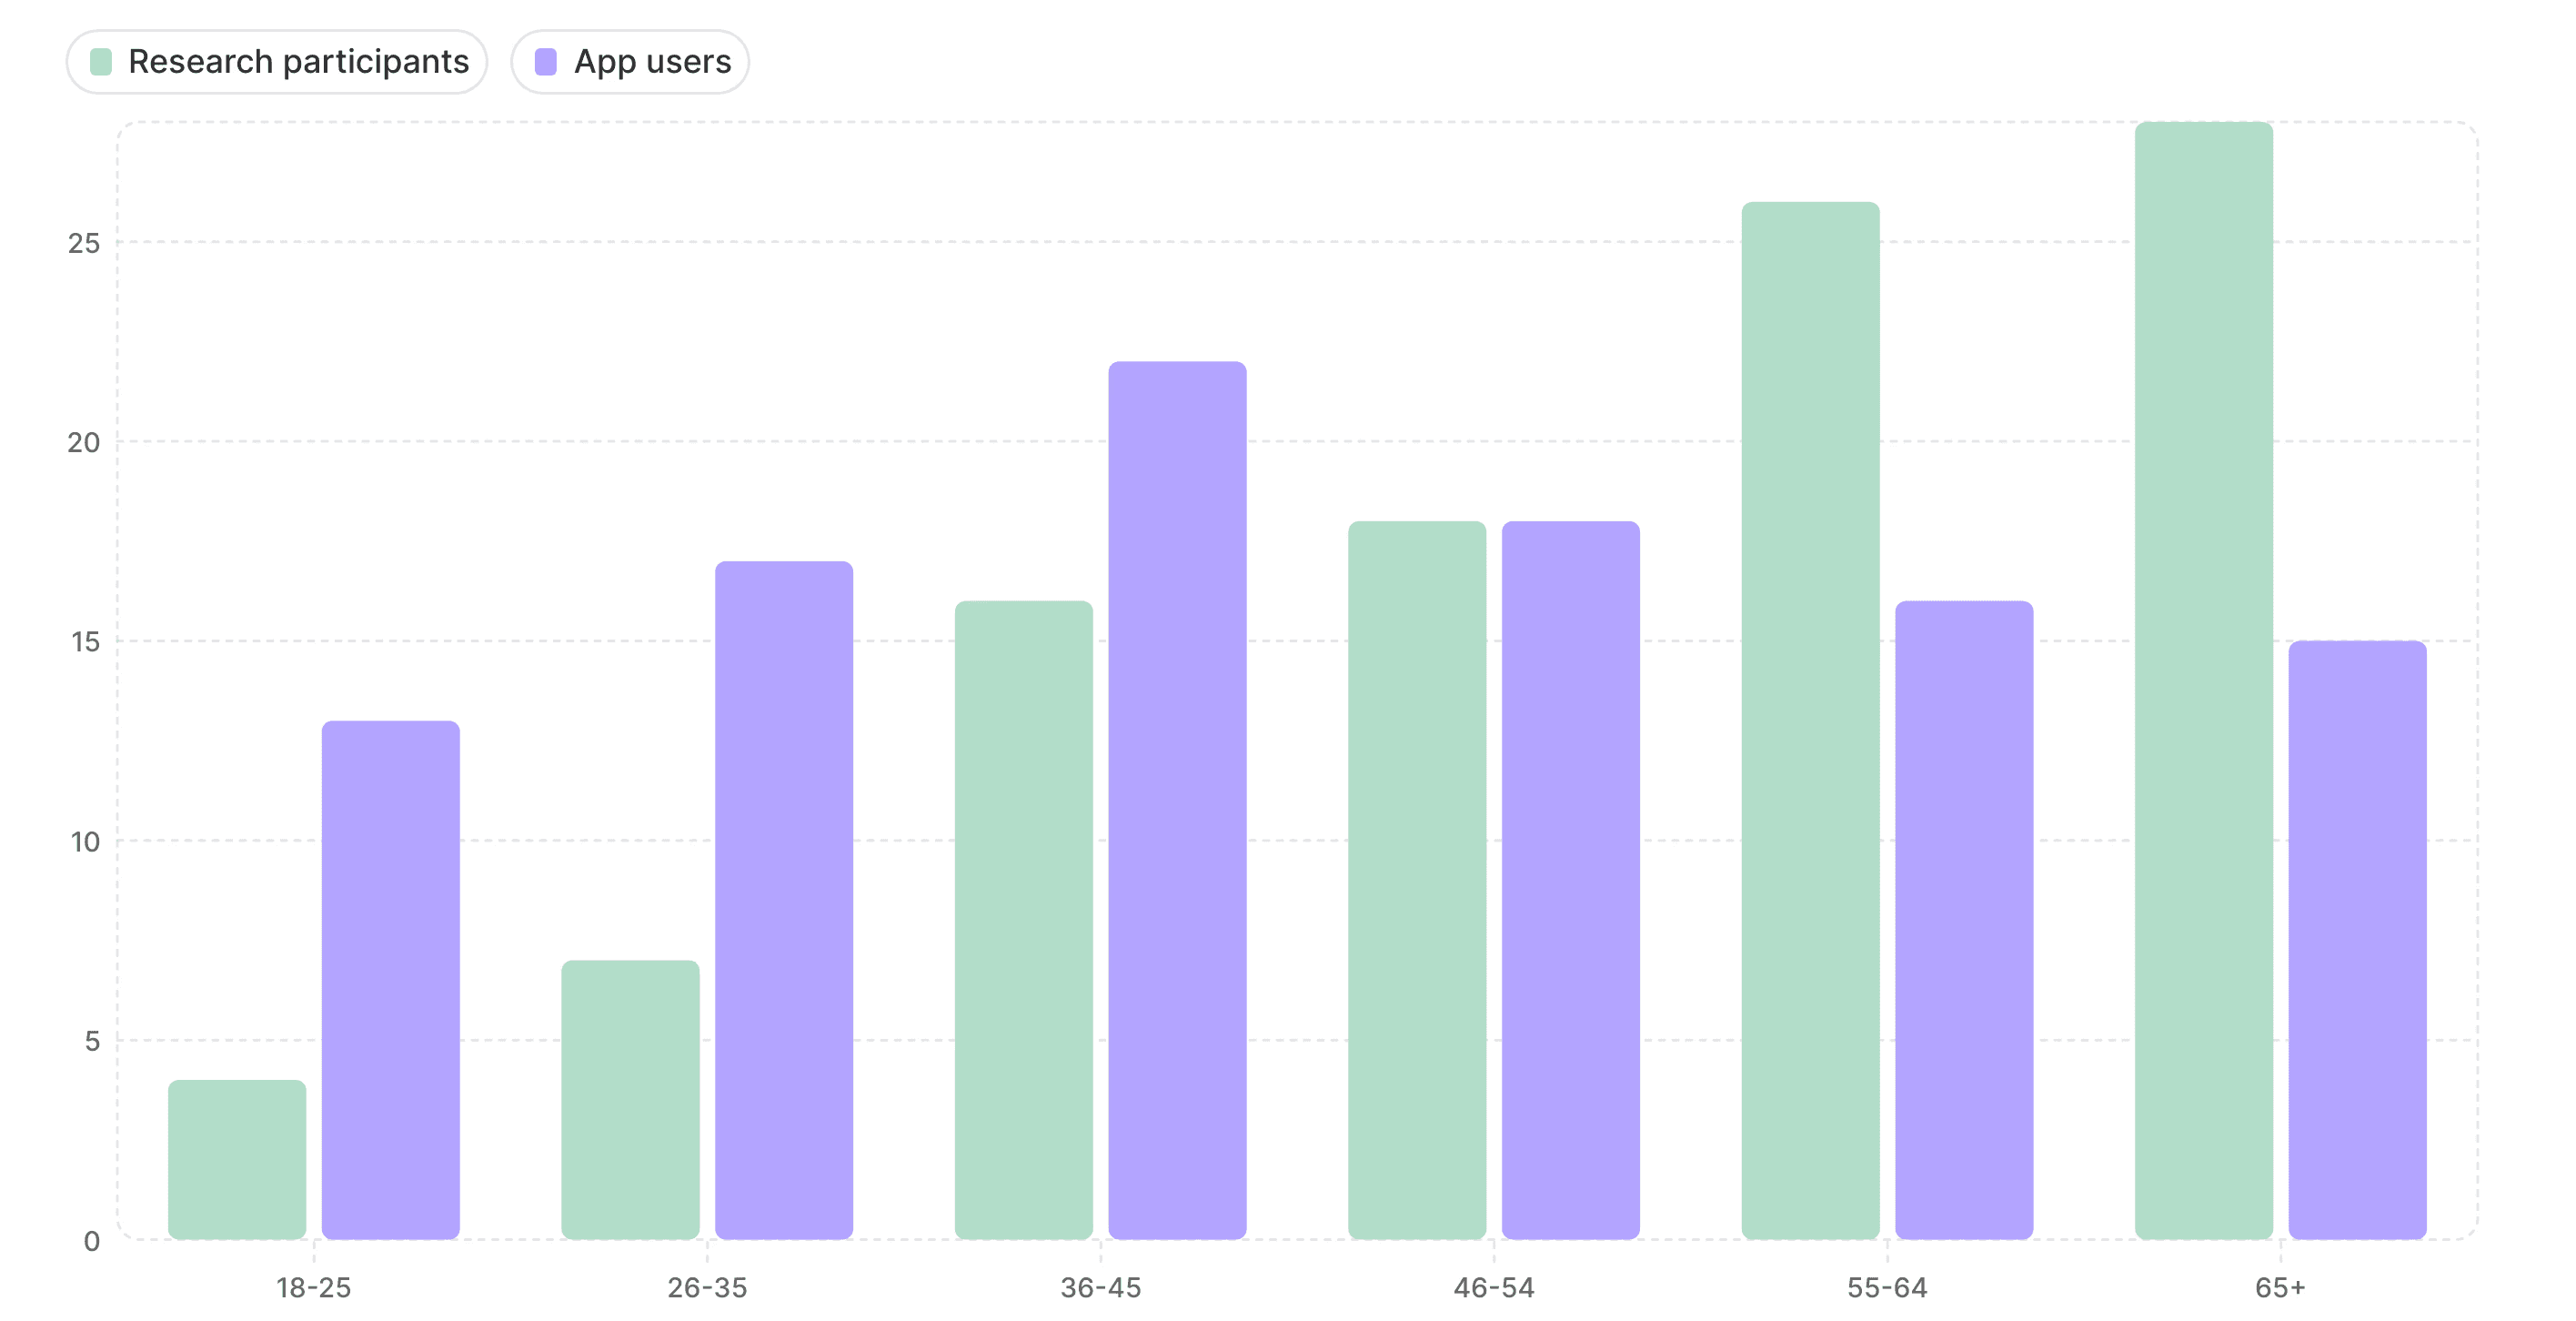
Participants in the research sample are older than actual app users
Success Rates by Age
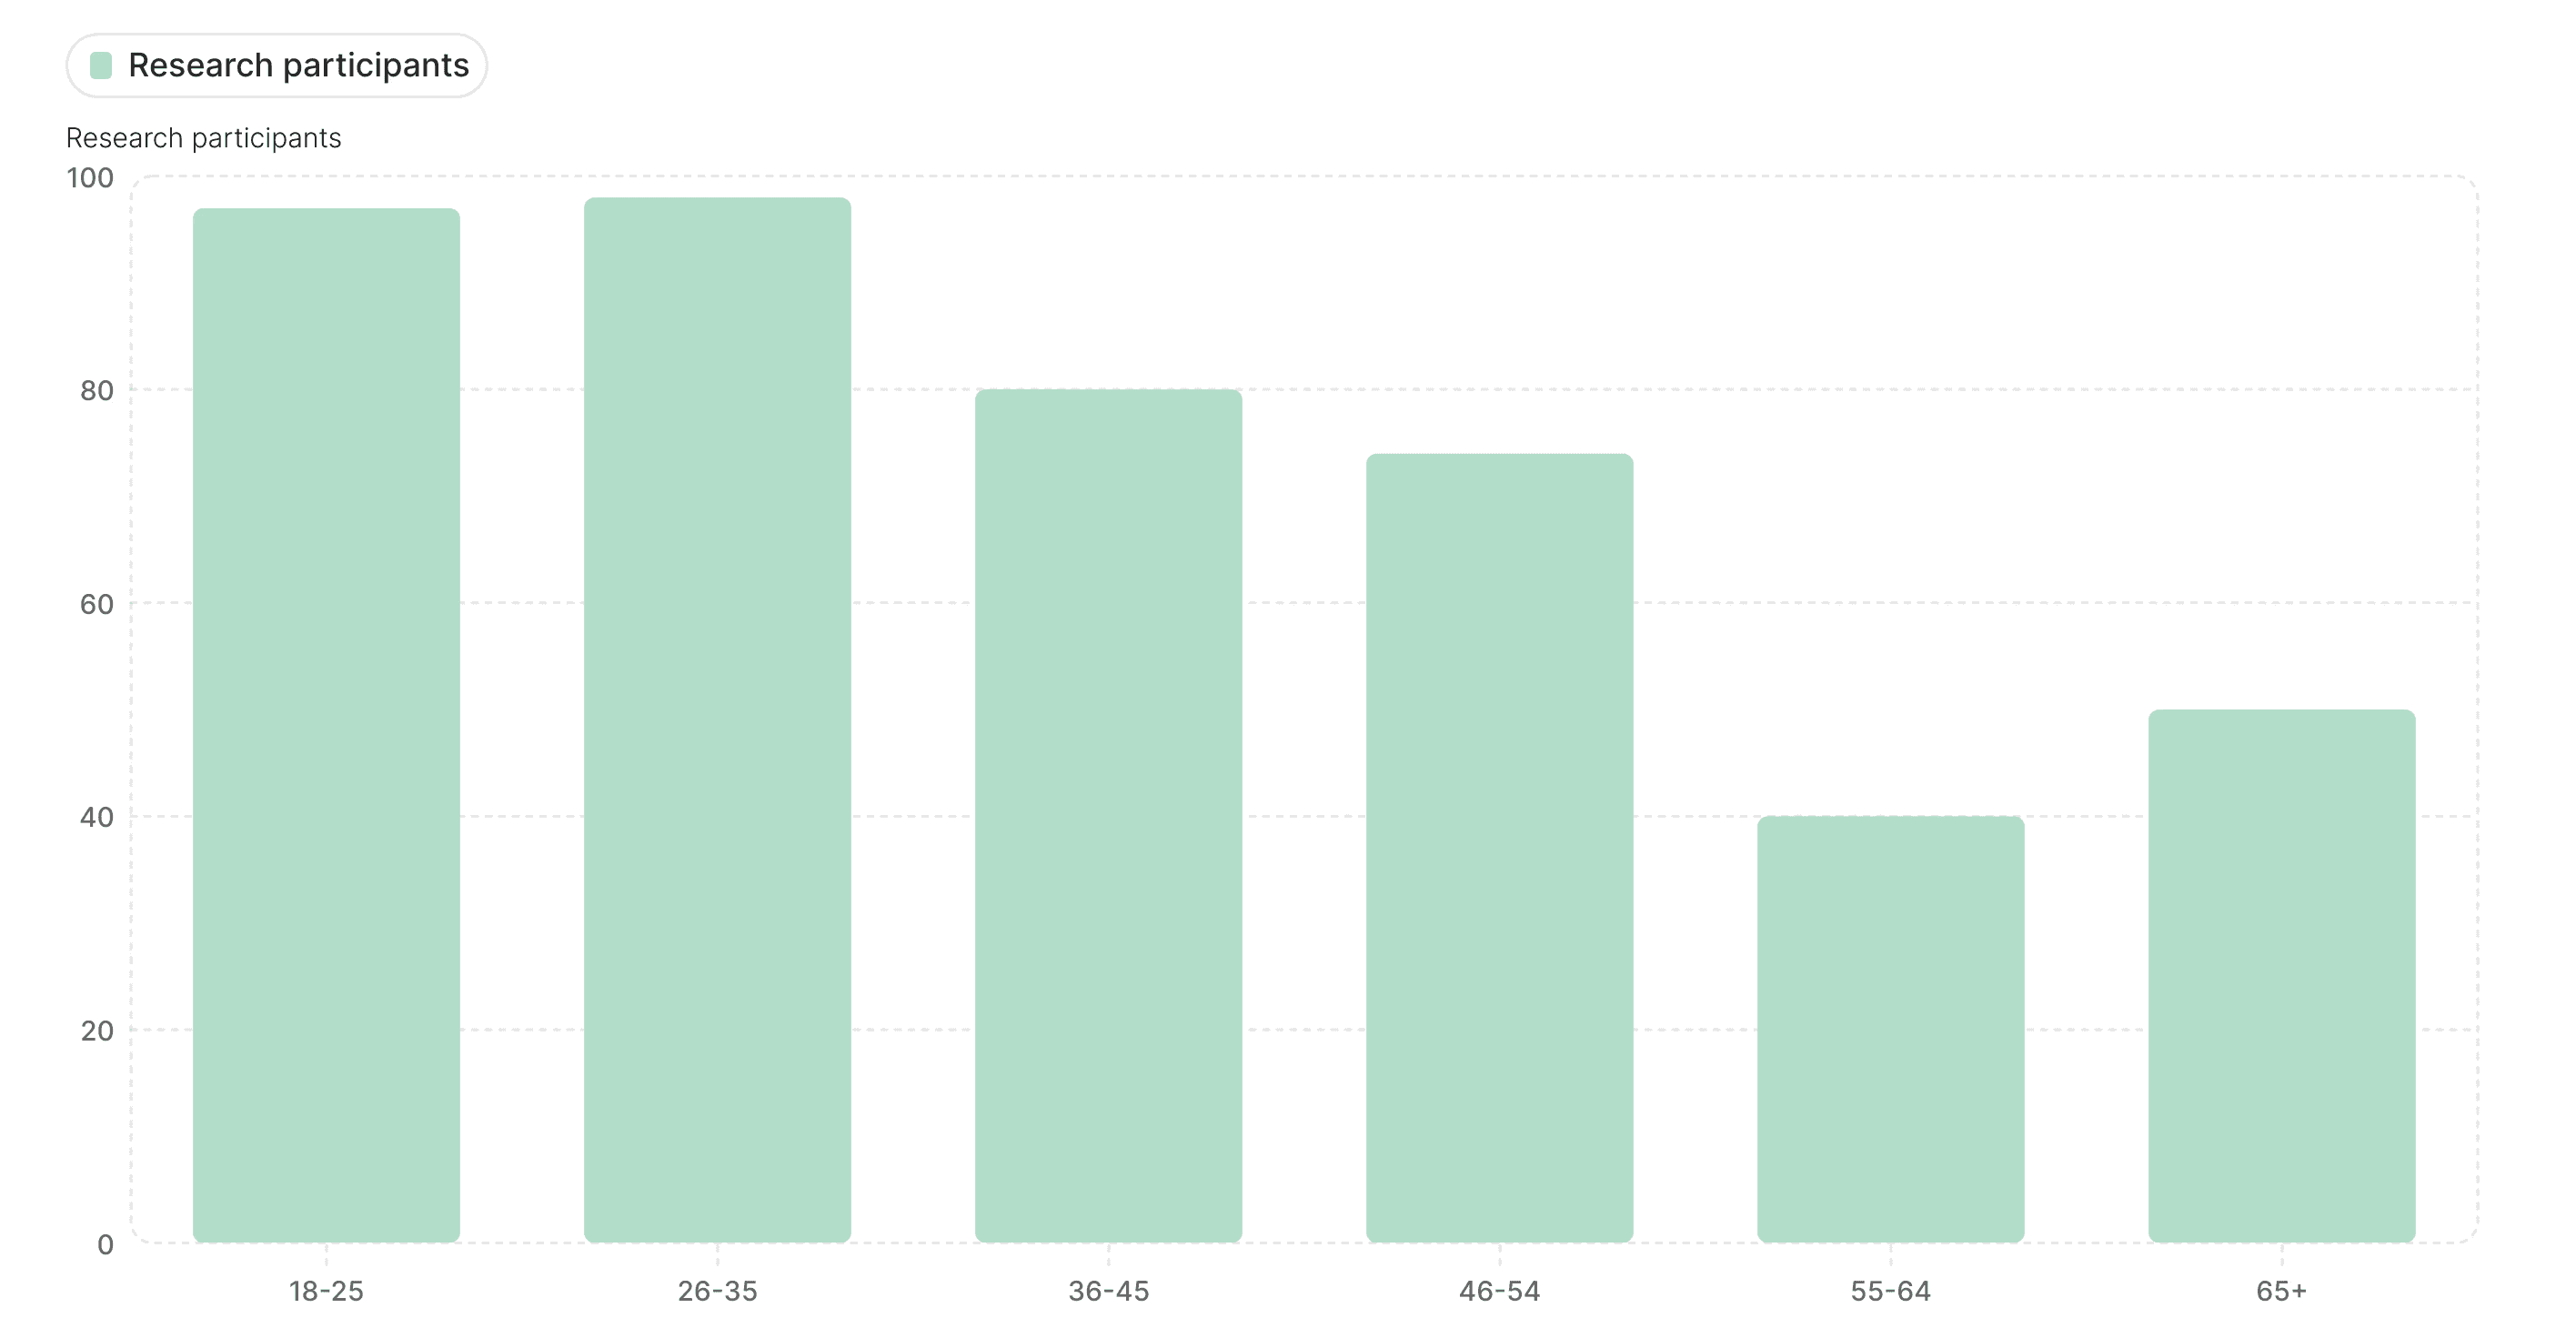
Younger participants performed better in the test
Reflection
Complaints should be tested, customer service reports might be biased
This project taught me that customer complaints, while important, can be misleading. Data-driven validation prevented us from making a costly rollback. I also learned the importance of looking beyond surface-level metrics: user demographics explained why the new design performed even better with our core audience. Most of all, I reinforced my belief that great UX research doesn’t just solve usability problems: it prevents bad business decisions